ggplot2: Legend - Part 3
data-visualization
ggplot2 - Legend Part 3
Introduction
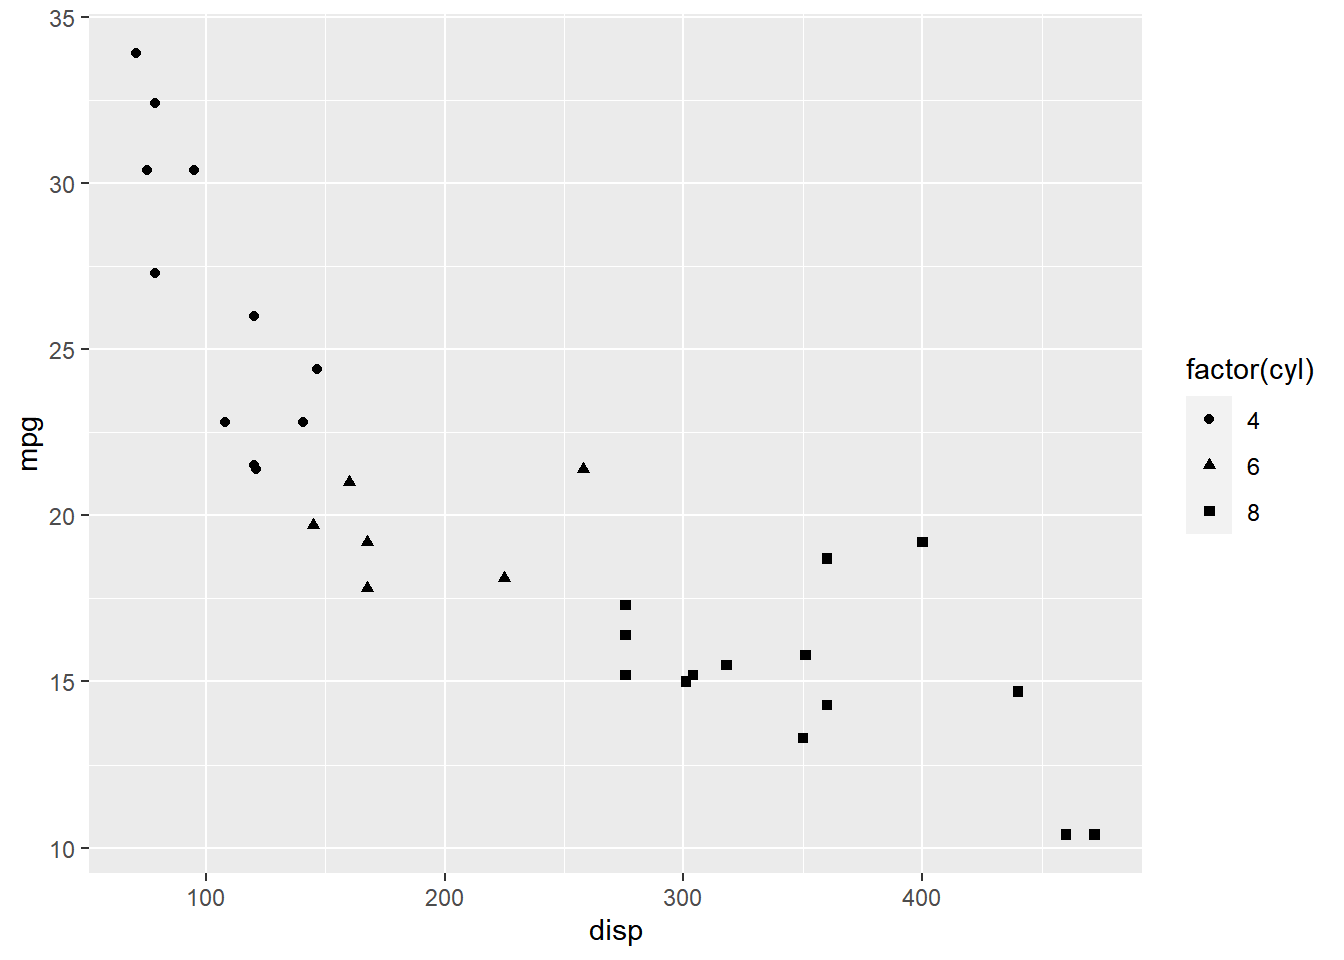
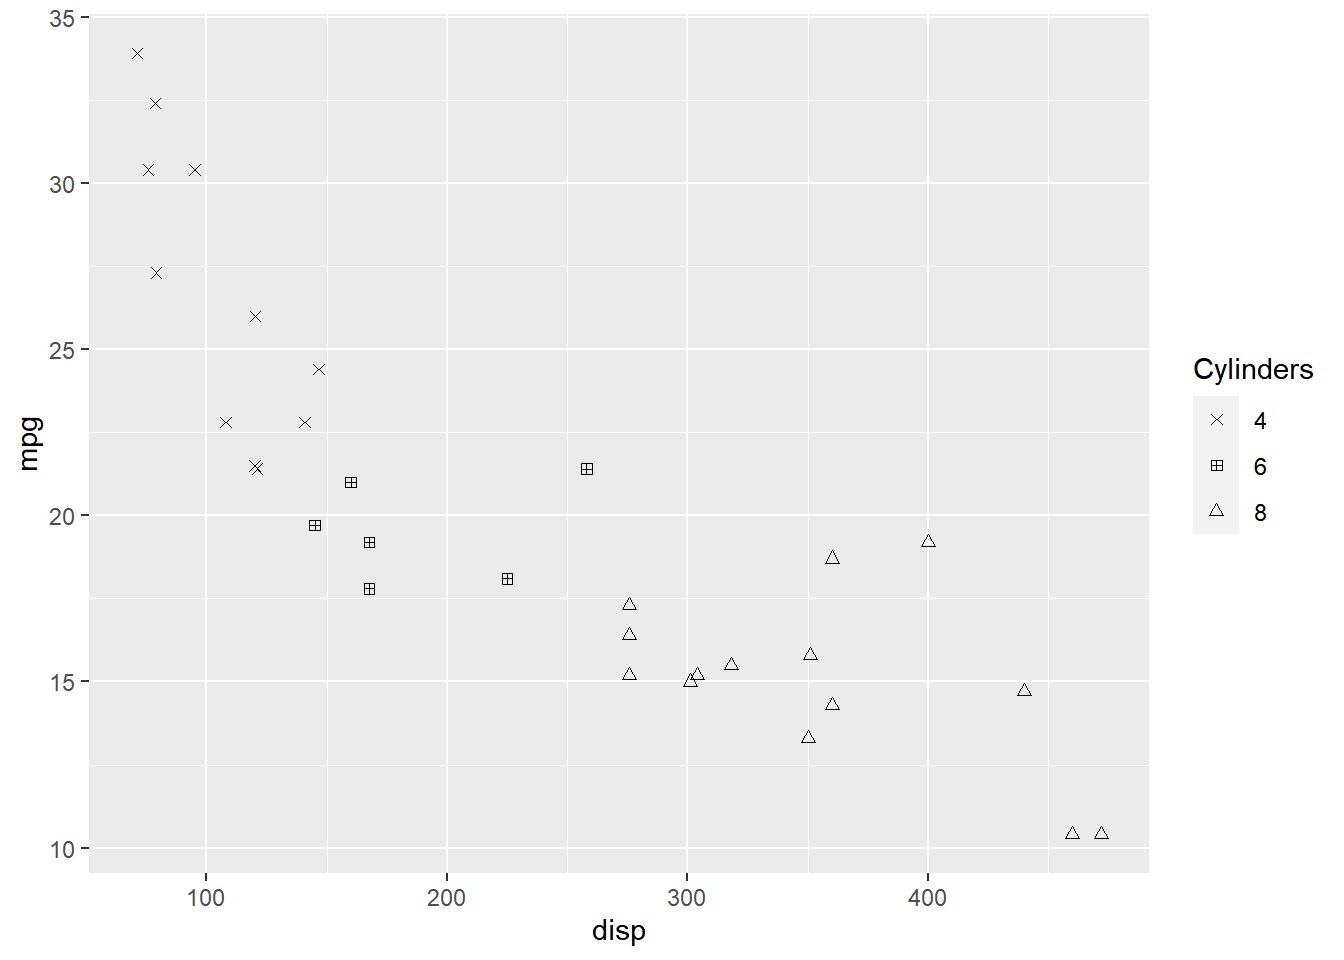
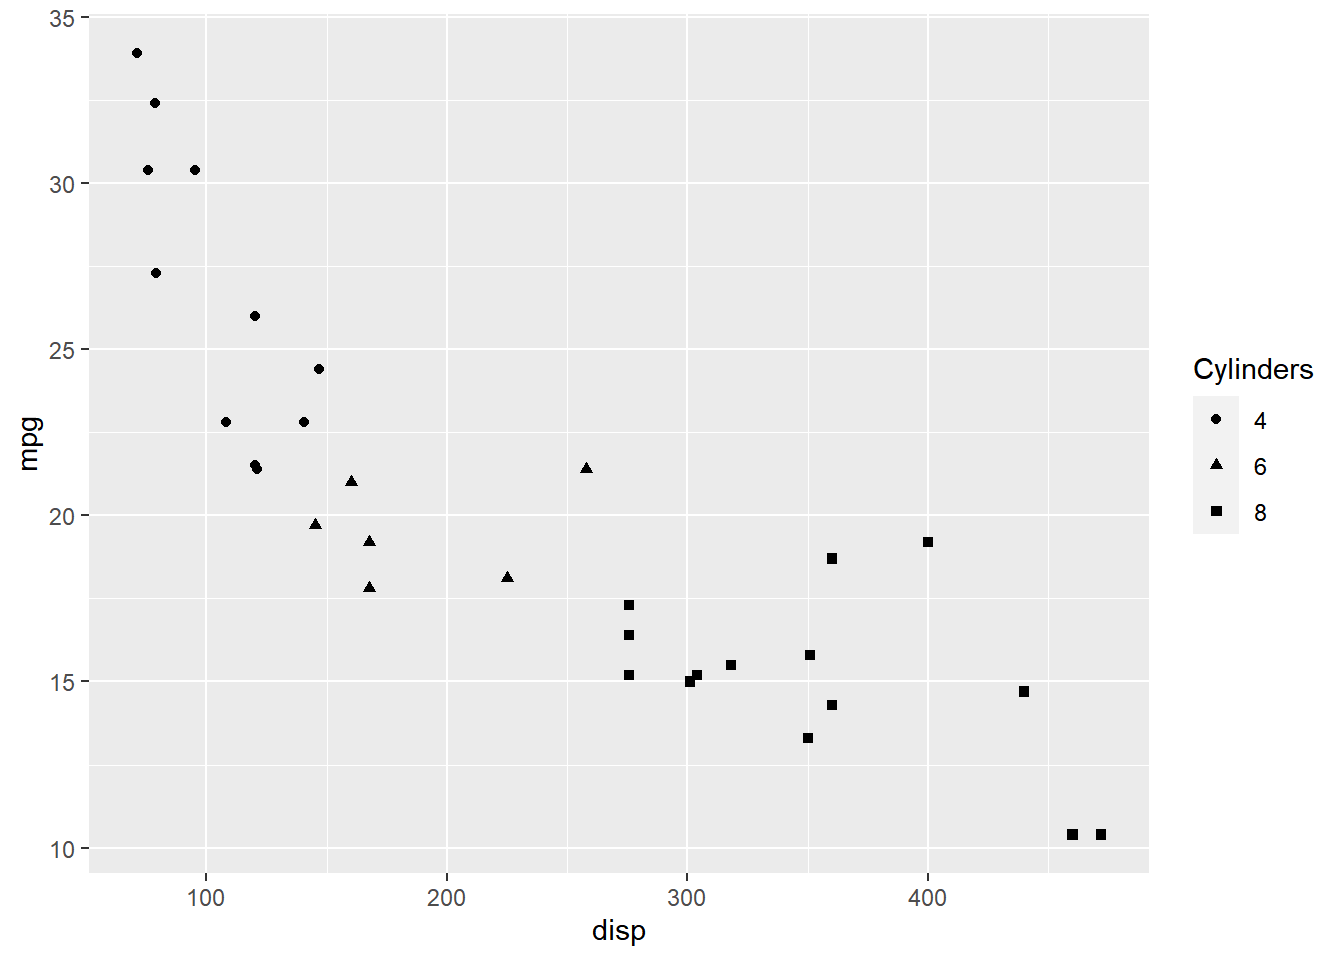
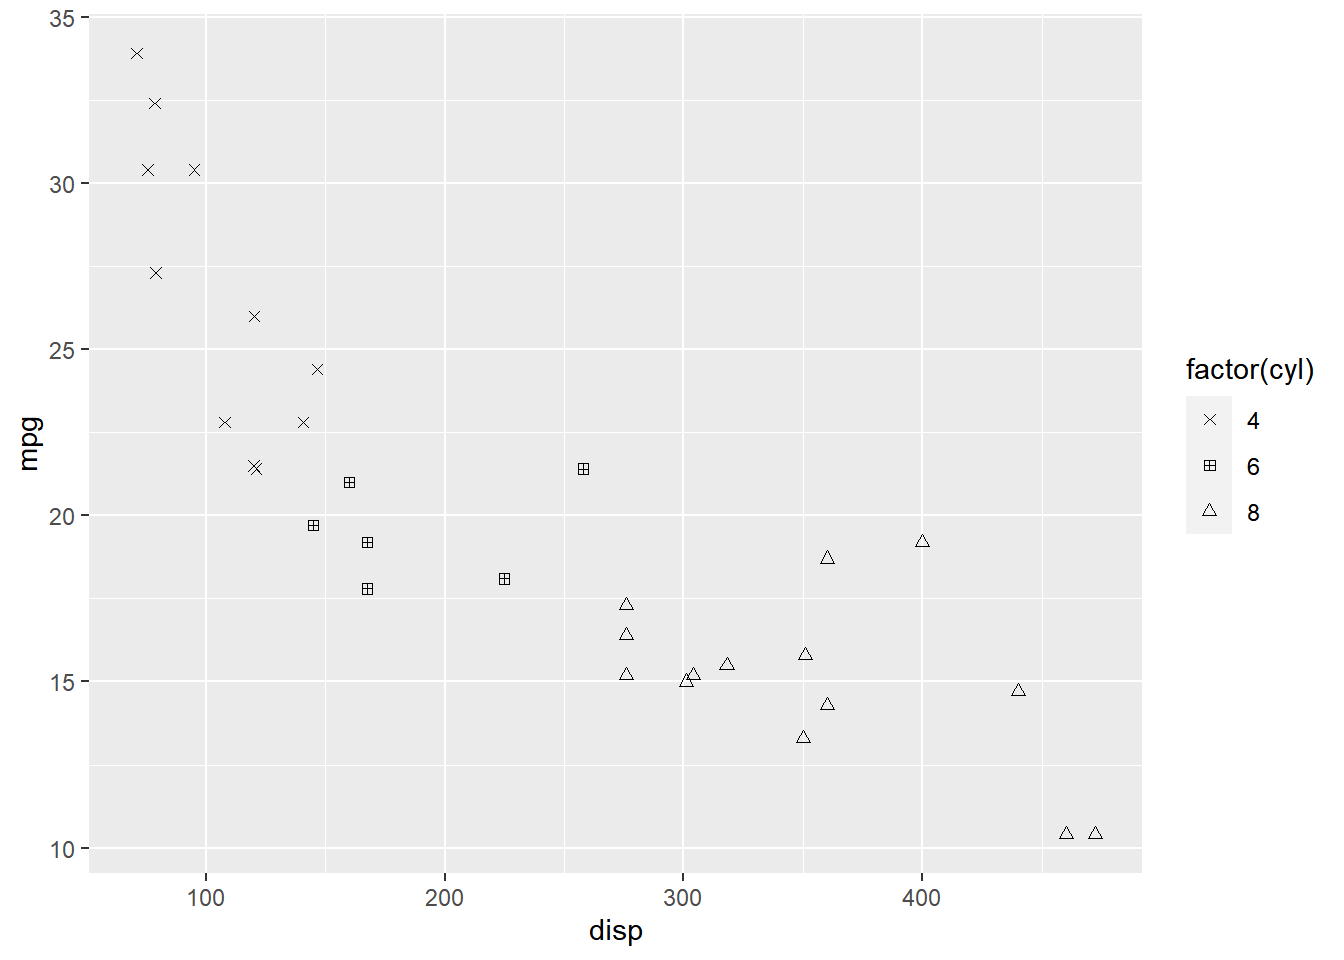
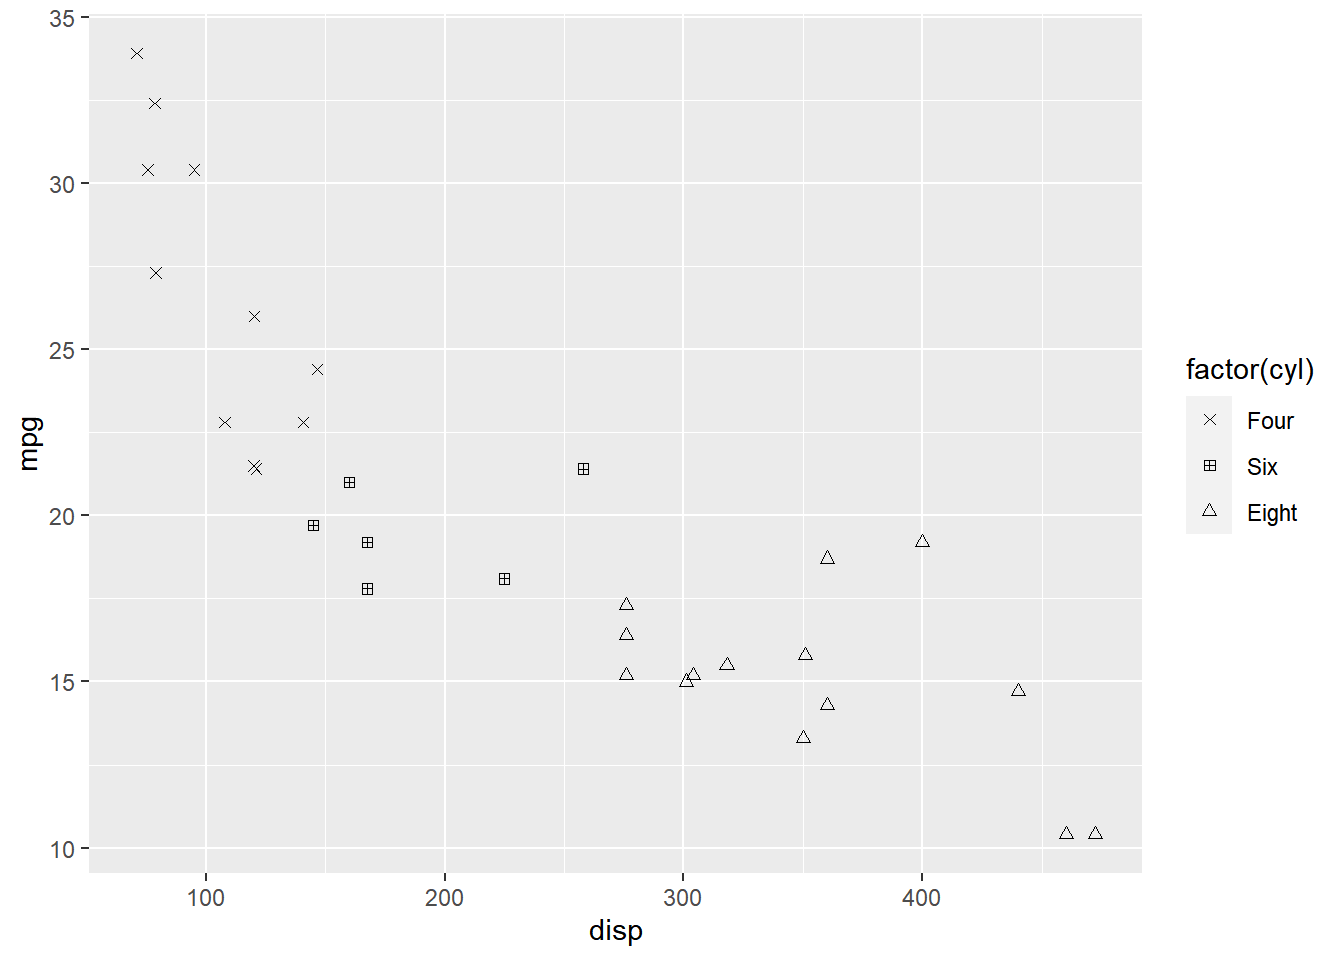
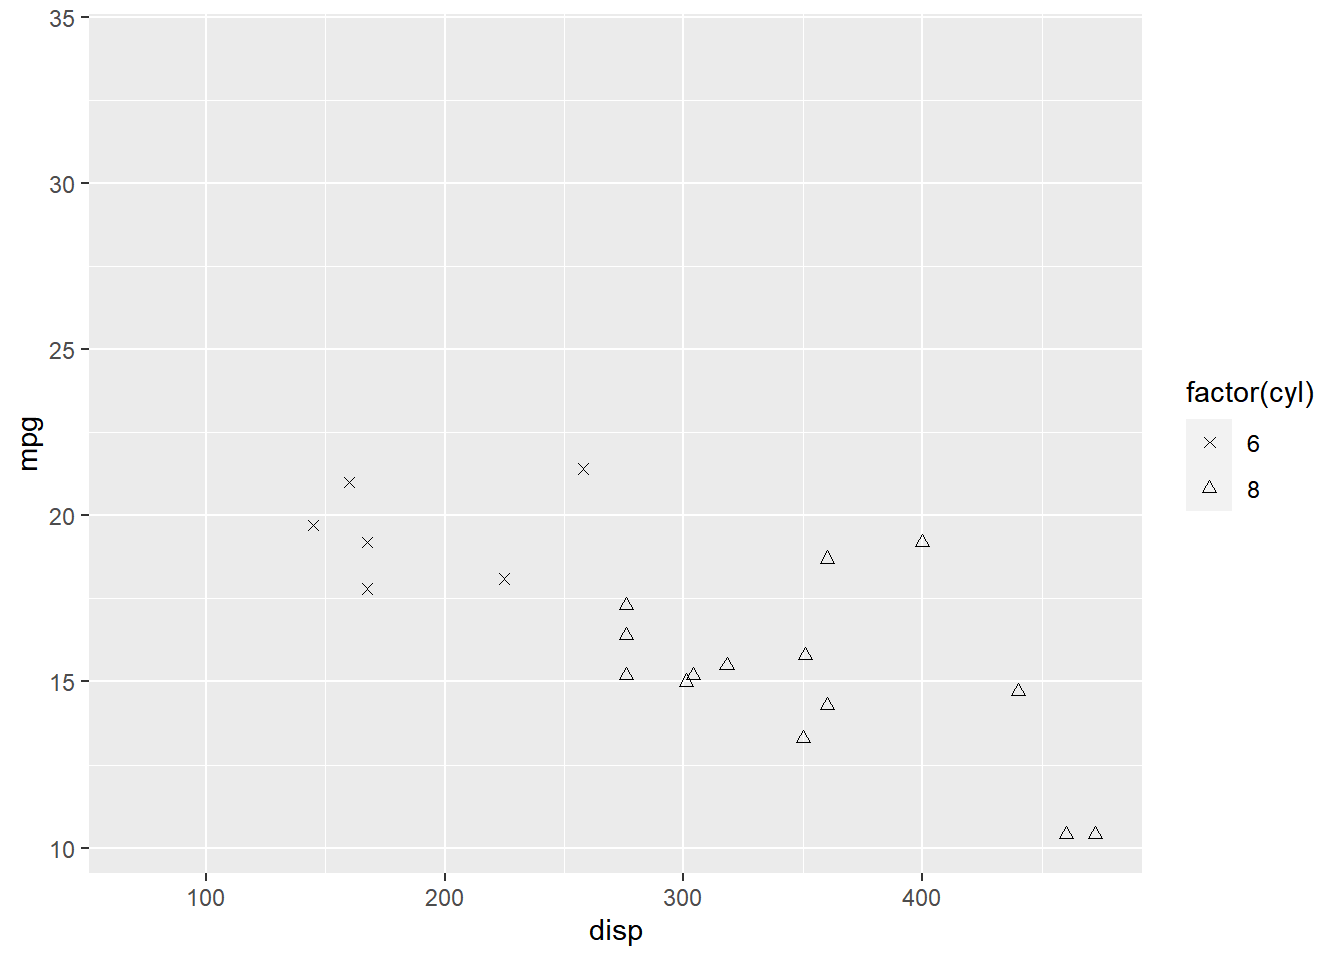
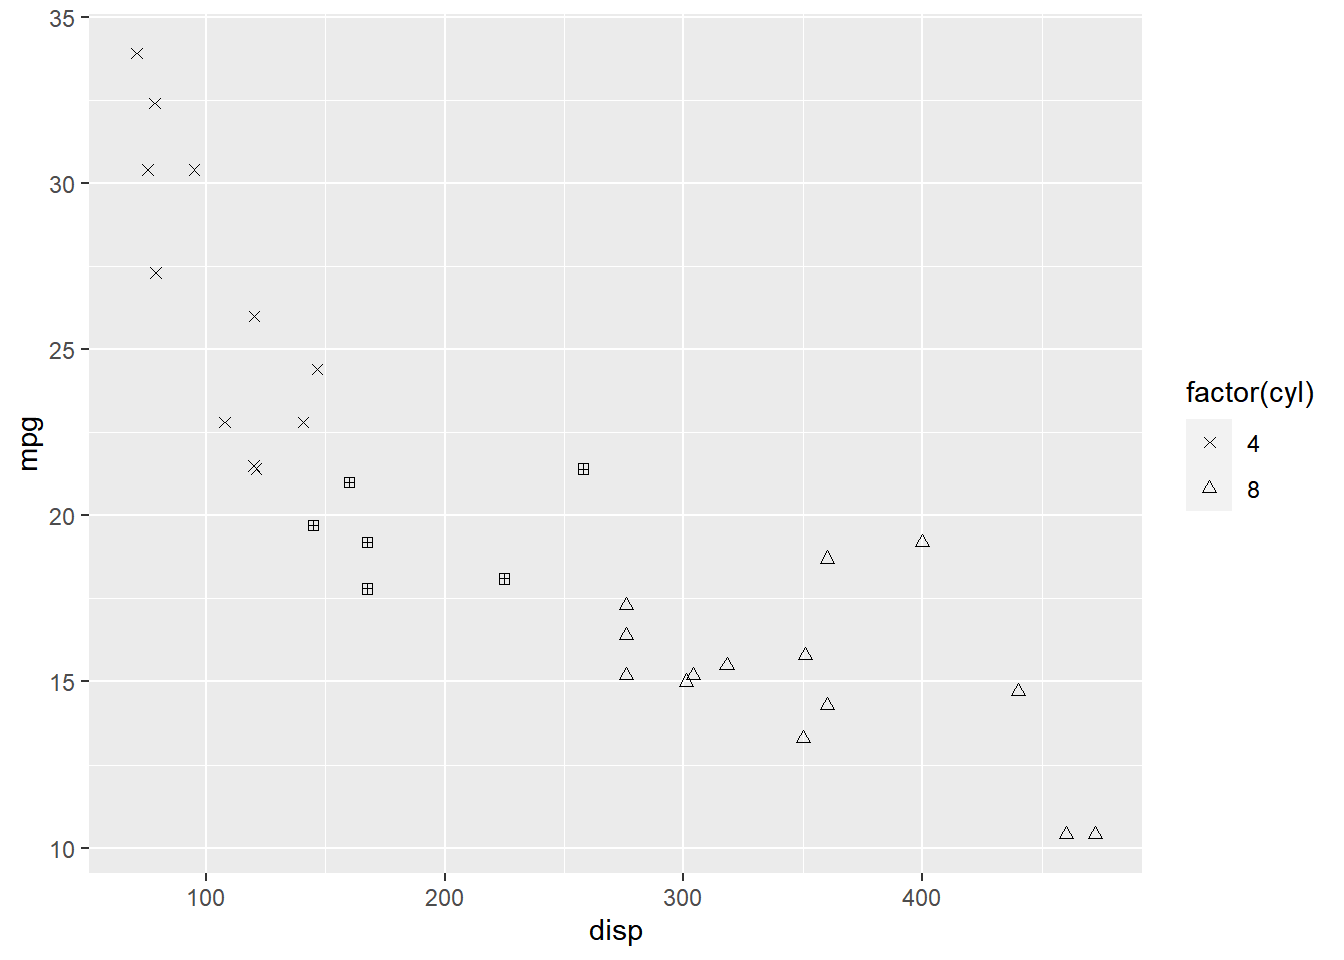
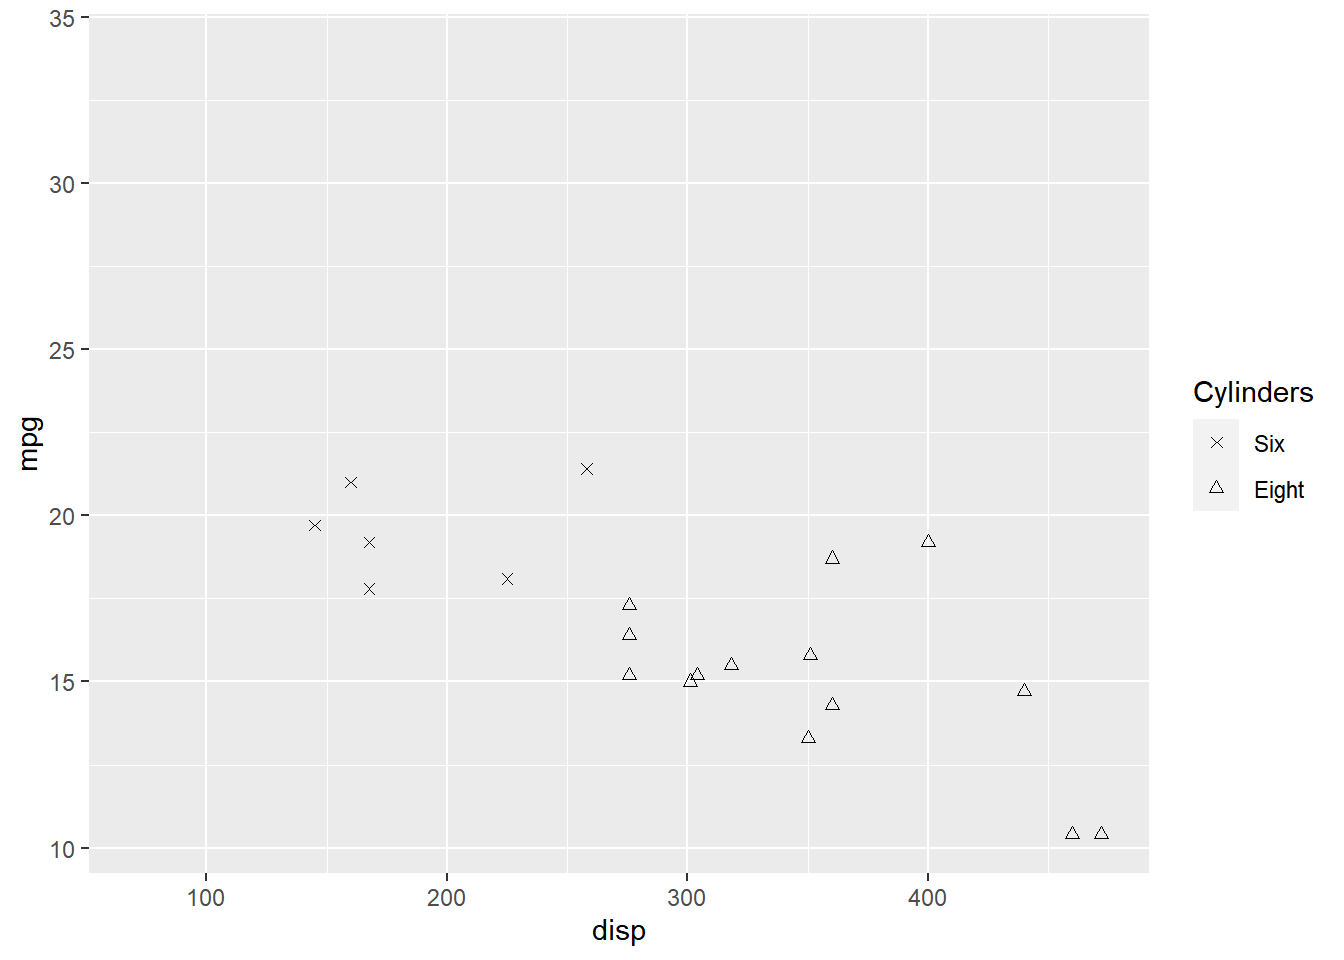
This is the 15th post in the series Elegant Data Visualization with ggplot2. In the previous post, we learnt how to modify the legend of plots when aesthetics are mapped to variables..In this post, we will learn to modify the following using scale_shape_manual when shape is mapped to categorical variables:
- title
- breaks
- limits
- labels
- values
Libraries, Code & Data
We will use the following libraries in this post:
All the data sets used in this post can be found here and code can be downloaded from here.